Understanding Giniä: A Key Measure of Income Inequality
- September 24, 2025
- 0
Income inequality is one of the most pressing issues facing modern societies. With the gap between the wealthy and the poor growing ever wider, understanding how wealth is
Income inequality is one of the most pressing issues facing modern societies. With the gap between the wealthy and the poor growing ever wider, understanding how wealth is

Income inequality is one of the most pressing issues facing modern societies. With the gap between the wealthy and the poor growing ever wider, understanding how wealth is distributed within a population becomes crucial. The Giniä coefficient is a widely used statistical measure to quantify income inequality. This article explores what the Gini coefficient is, how it is calculated. And why it’s such an important tool for policymakers, economists, and researchers.
The Gini coefficient is a metric that measures income or wealth inequality in a population. It was developed by Italian statistician Corrado Gini in 1912. The Gini index provides a numerical representation of the distribution of income or wealth, with values ranging from 0 (indicating perfect equality) to 1 (indicating extreme inequality). The closer the Gini index is to 1, the greater the level of inequality.
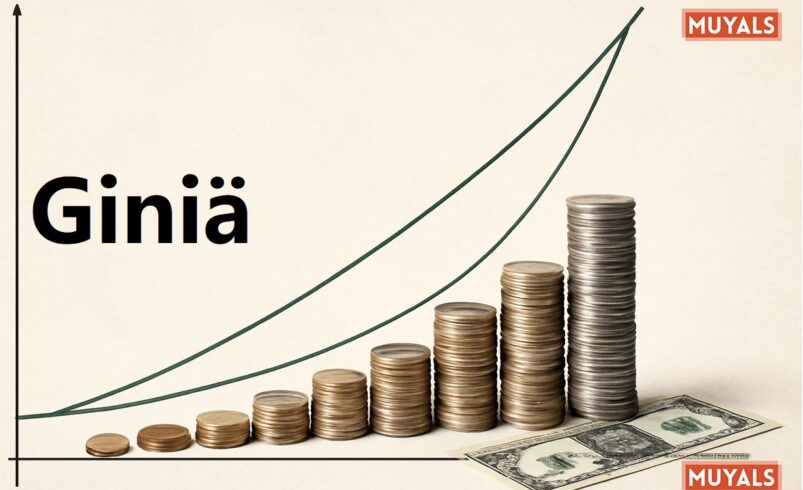
The Gini coefficient is calculated by plotting a Lorenz curve, which shows the cumulative percentage of total income received by the bottom x% of the population. The area between the Lorenz curve and the line of perfect equality represents income disparity. The Gini coefficient is the ratio of the area between these two curves to the total area under the line of perfect equality.
It serves as a key indicator of inequality. Economists and policymakers use it to assess the fairness of income distribution within a country. A high Gini coefficient signals that a small group controls a large portion of the wealth, while a low Gini index suggests a more even distribution of income.
In 2019, Denmark had a Gini coefficient of approximately 0.26, meaning the country has a relatively equal distribution of income. In comparison, South Africa had one of the highest Gini coefficients at around 0.63, reflecting a more unequal income distribution.
Governments often rely on the Gini coefficient to design and evaluate policies aimed at reducing inequality. For example, countries with high Gini coefficients may implement policies such as progressive taxation, welfare programs, and income redistribution schemes to level the playing field. Conversely, countries with low Gini coefficients often focus on sustaining economic growth and ensuring continued access to education and healthcare for all citizens.
The Gini coefficient can also provide insight into the broader relationship between inequality and economic growth. Some researchers argue that high inequality stifles growth by limiting opportunities for the broader population. Conversely, countries with lower inequality often experience more robust economic growth, as a larger portion of the population has access to opportunities for success.
In business, the Gini coefficient is used to understand market dynamics and consumer behavior. Companies may use the Gini index to analyze income distribution within a particular market. A high Gini coefficient suggests that a small group of wealthy individuals dominates the market, while a low Gini coefficient indicates that the market is more evenly divided among consumers.
Businesses can adjust their strategies accordingly targeting high-income segments with luxury products or catering to broader, more diverse customer bases with affordable options.
Investors also look at the Gini coefficient to assess the stability of a country’s economy. High levels of income inequality can be a sign of political instability, which may affect investments. A more equitable income distribution can contribute to social stability and, by extension, a more favorable investment climate.
Institutions like the World Bank and the United Nations publish Gini indices for various countries to compare the level of inequality worldwide. These comparisons provide valuable insights into global economic health and help guide international policy development.
Countries like Norway and Finland consistently rank among the most equitable nations, with Gini coefficients of around 0.25. On the other hand, countries like Brazil and South Africa have high Gini coefficients, indicating the need for targeted measures to address income inequality.
The Gini coefficient also plays an important role in measuring progress toward global development goals. By monitoring changes in the Gini coefficient over time, development organizations can assess whether their initiatives are having the desired impact on income distribution.
In conclusion, the Gini coefficient is an invaluable tool for understanding and addressing income inequality. It offers clear insights into the distribution of wealth within a country and helps inform social. And economic policies that promote greater equity. Whether used by governments, businesses, or researchers. The Gini coefficient plays a crucial role in shaping strategies that aim to reduce inequality and foster more inclusive growth.
The Gini coefficient is used to measure income inequality, providing a snapshot of how wealth is distributed across a population.
The Gini coefficient is calculated by measuring the area between the Lorenz curve and the line of perfect equality. A larger area indicates greater inequality.
Countries with low Gini coefficients include Denmark and Norway, while countries with high Gini coefficients include South Africa and Brazil.
Visit More: Muyals